 Pump
Magazine On-Line
Pump
Magazine On-Line

INDUSTRIAL DIGEST
|
INDUSTRIAL DIGEST
|
|
|
Article 51: BENEFITS OF THE ON-LINE VIBRATION ANALYSIS VERSUS VIBRATION TRENDING
by Lev Nelik, Ph.D., P.E., Pumping Machinery, LLC Hiram Tanner, DC WASA, Washington, DC Phil Higgins, DC WASA, Washington, DC
Vibration monitoring of rotating machinery has definite benefits as far as an early warning of bad things beginning to develop inside the machine. As companies migrate from a passive run-to-failure approach to a proactive/preventative maintenance methods, questions are asked about how to start, what approach to choose, and how sophisticated it needs to be.
In the past issues of Pumps & Systems, we have touched on various methods to most effectively strike a balance between sophistication and pragmatism. Not every plant may need the type of the full blown transient electric current analysis as described in the September 2007 issue of P&S (“Transient Startup Problems for Pumps with Synchronous Motors”), - in which high speed real-time start-up fluctuations of the motor amps were analyzed and motor tripping problem solved after several months of complex testing. A better way to begin is to identify critical equipment (not every pump, motor, mixer, or similar needs to be part of the program), and simply begin recording the trend of vibrations, with a simple (and inexpensive) hand-held vibration analyzer which shows nothing more than the overall (rms) values of vibration (ref. P&S June 2009, “Trending Revelations in Vibrations Analysis”). That particular article described the manner and logistics of various vibrations program philosophies plants tend to follow. Machinery survey usually proceeds the formal launch of the program, in order to determine the most critical machinery to start with (P&S December 2009 article “Pump Reliability and Energy Surveys”).
By the end of 2009, we received voluminous feedback, as well as questions, regarding what constitutes a proper balance between a simple overall vibration velocity values trending, and complex FFT spectral analysis, and we summarized this feedback in August 2010 article “Think simple Before Rushing to Fancy Analysis”, and “Vibration Analysis simplified” in November 2012 P&S issue, and “Facts and Fiction About Vibration” in March 2011 issue.
In P&S September 2011, “Vibration Analysis to Improve Pump Reliability and Save Energy” article, we showed how initial simplified vibrations program can be gradually expanded, to include some impact of pumps inefficiency and energy consumption concerns. Combination of simple trending vibration methods, coupled with the on-line real-time continues monitoring, present am next step for plants interested to elevate their vibration program to the next level, to better predict to the internal problem within the machine, long before the problem develops to a catastrophic failure, resulting in shutdown of a critical processes, putting the entire plant in danger of forced shutdown. An example of such case is described in this article.
In 2007, a major municipality in the Washington D.C. area engaged on a road of tracking reliability of its pumps via vibration analysis. Starting with a simple analyzer, initial efforts were limited to calling the in-house rotating machinery technician to look at the pump which exhibited high vibrations. Due to several plants, and large number of pumps, it was difficult to service the units at the early signs of trouble, and by the time he would be looking at a problematic unit, the internal damage (bearings leaky seals, etc.) would already have developed substantially, resulting in need for expensive repairs, and downtime.
In 2009, municipality shifted focus on more regimented, and more systematic manner of looking at pumps, trying to anticipate the problem close to inception, before it developed into a significant and expensive issue. It helped significantly reduce the number and cost of catastrophic failures. However, while the majority of pumps under trending program was being done periodically (monthly), occasional undetected failure of some pumps still happened, despite the trending chart displaying no obvious signs of early distress, as recorded by the overall (rms) vibration data, with overall vibration being significantly below the warning (0.3 in/sec) and alarm (0.5 in/sec) values:
To understand the issue better, the plant technician and an outside consultant began looking into the issue more closely, and, after interviewing several operators of all three shifts, learned that the pumps tend to exhibit very high vibrations only occasionally, and at unpredicted times:
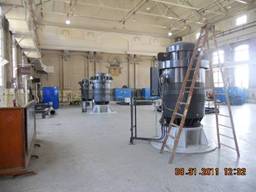
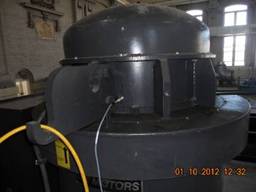
These (4) raw sewage pumps move up to 62,500 gpm each, driven by 700 hp electric motor, at 355 RPM max speed, with speed regulated by a VFD, in response to the wet well level, as a function of the incoming flow.
A closer review revealed several things, some appeared to be related to the pump (or motor), and other to the system. One of the first things discovered was incorrect setting of the motor/pump minimum speed, which was not set low enough to accommodate the low flow times (usually at night), which would cause the motor to completely shut down, and then restarted again a few minutes later, as the wet well level would build up again. Readjusting the minimum speed setting solved the problem of frequent starts/stops, thus significantly improving the impact on the motor life, but the high vibrations spike still persisted.
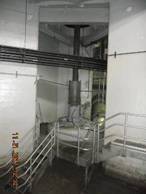
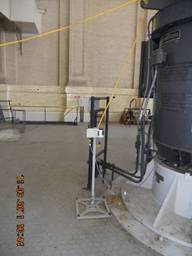
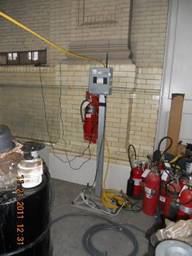
To understand that, a continuous vibrations monitoring system was installed by the consultant:
The system consist of the Data Module (DM) installed near the motor and pump, with triaxial vibrations/temperature combination sensors connected by the long extension cables to the DM. The DM unit transmits the radio signal to the Communication Module (CM), which send the radio signal to the tower, which then route the signal to the network. Plant technicians, maintenance, and operators, can then view the data directly on their computers via the internet connection from any location:
As can be seen on the chart above, vibrations spike from a low level of approximately 0.05 in/sec (which is what monthly single-measurement data tracked), to a very high level acceding the warning, and close to the 0.5 in/sec alarm. The vibration and temperature sensors were installed at the several locations on a motor and a pump, but the high level of vibration was recorded only at the top of the motor. The lower part of the motor and the pump experienced no such spike, and had very low vibration reading, similar to 0.05 in/sec magnitude.
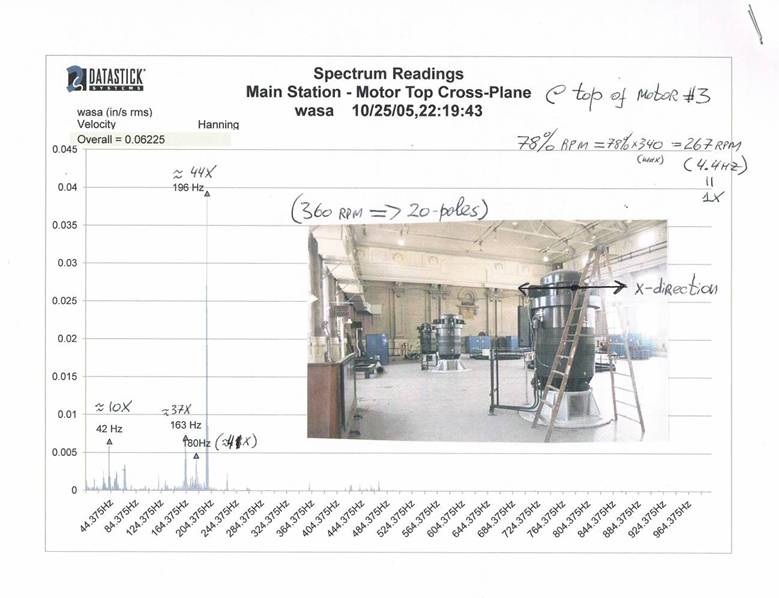
The full spectral analysis signature showed the following:
From the FFT plot, the main high spike frequency is at 196 hz, a 44 times the running speed value of 267 RPM (4.4 Hz) at the time of the test.
While the problem appeared to be located to the upper part of the motor, if was unclear of the specific source of its excitation. Possible suspected culprits were: resonance, motor electric (rotor bars) issues, or VFD harmonics and noise filtering issues.
To determine that, an additional “bump test” was performed on the idling pump, to indentify the response frequencies:
The “bump test” identified the natural resonance frequency of 196 Hz being the route cause. However, it was still unclear which particular component of the motor, pump, supporting structure, of a combination of these, was the reason for the resonance.
Additional tests were conducted along the entire length of the unit, at various positions, which indicating the highest vibrations emanating from the area of the motor lifting lugs:
There are (11) short steel ribs at the upper part of the motor housing, and (2) longer lugs which are used to lift the motor. Dimensions of the lifting lugs are 18” x 12” x 1”.
Finite Elements Analysis (FEA) of the lifting lugs was performed by a computer simulation, to see the natural modes of frequency resonance (the first three shapes of resonance modes are shown:
The dynamic simulation of the resonance harmonics are shown at the attached three video clip files: mode1.avi / mode2.avi / mode3.avi
In a model a simplified model of the lifting plate was approximated as 2” thick plate, 18” long by 12” high. The exact manner of the plate attachment to the motor frame was difficult to see without disassembly of the part of the motor frame. If most of the attachment boundary is along the short edge of the plate, the natural frequency of resonance would obviously be somewhat less than if the plate is attached mostly along the wide edge. The true resonance is probably somewhat in-between these constraints.
The mostly short edge FEA analysis predicted 102 Hz first harmonic and 345 Hz harmonic. The tested (field bump test) value of 196 Hz is inside this range, indicating a strong possibility of the predicted structural resonance of the upper side of the motor lifting lug structure, although a more accurate model would need to be constructed to get a more accurate correlation.
Conclusions Vibration trending analysis aided by the FFT spectral analysis provides a valuable tool to predict and anticipate pumps developing issues before they evolve into problems. Such predictive maintenance approach helps also identify system related deficiencies, and allows proper adjustments, to fine tune and optimize overall equipment operation. Collectively, these methods result in significant savings on avoided costs of catastrophic failures, and results in more informed and educated team to maintain and operate critical equipment at their plants.
Dr. Lev Nelik, P.E. Editor, Pump Magazine On-Line April 2012
|